
Plan
01 · Context
Decision context
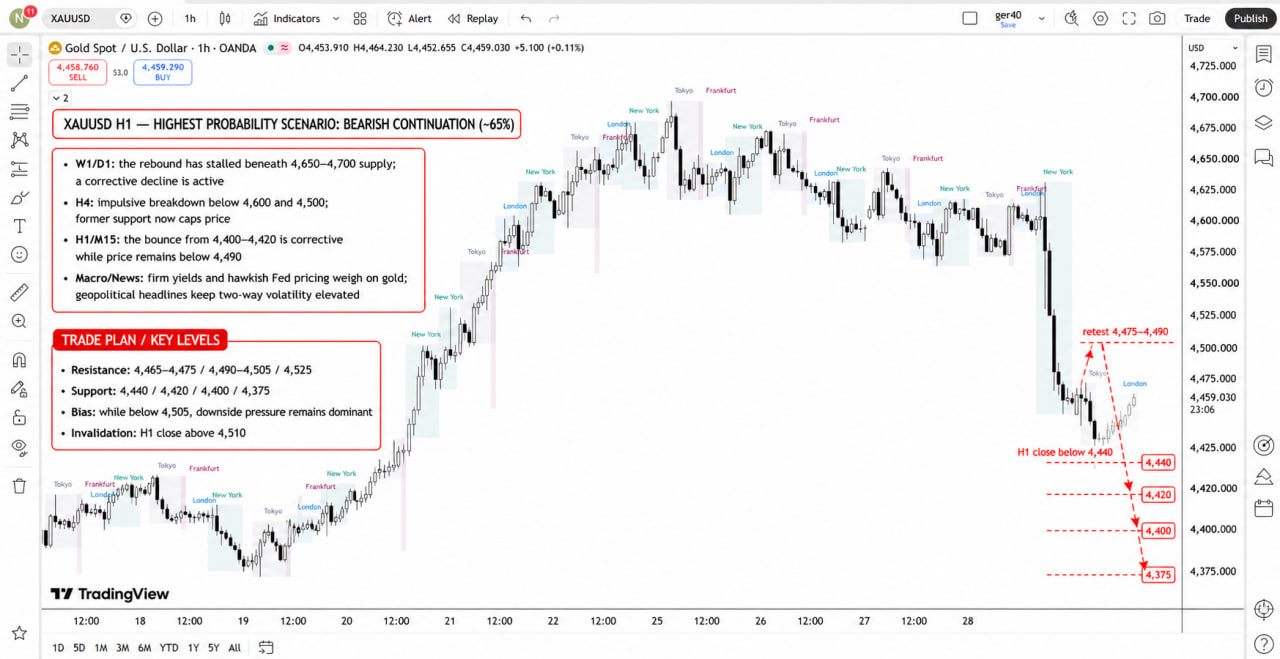
On higher timeframes, recovery stopped below the 4 650–4 700 area. The plan considered continued downside.
After the H4 breaks of 4 600 and 4 500, former support became a possible barrier to upside.
The bounce from 4 400–4 420 was treated as a correction below 4 490. The scenario allowed a return to 4 475–4 490 before a decline.
This context belongs to the archived plan. Its macro commentary is outside the price-path review.
02 · Original version
Original chart and levels
 Expand chart
Research scenario · For independent analysis · Not personal investment advice
03 · Conditions
Continued downside
An hourly candle close below 4 440.
A possible return to 4 475–4 490, followed by a decline to 4 420, 4 400 and 4 375.
An H1 close above 4 510 invalidates the scenario.
Reference levels after invalidation
Return to upside
An H1 close above 4 510 is a reason to reconsider the downside scenario.
Recovery reference levels: 4 465–4 475, 4 490–4 505 and 4 525. The original plan contains no separate buying rules.
The original does not specify an invalidation condition for the alternative.
Result
04 · Review of 7 Sep
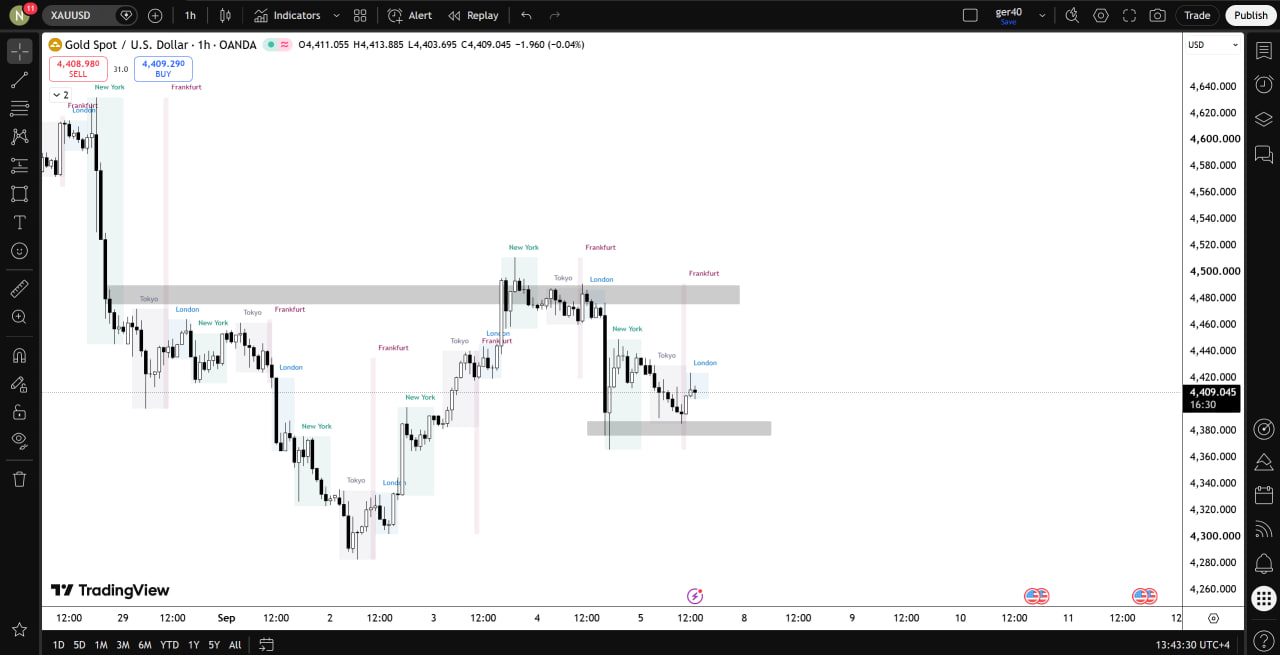
Three downside levels were passed. The market then recovered.
After passing the lower levels, price returned to 4 500 and declined again: direction matched the plan, but the week's path was more complex than the diagram.
 Expand chart
Research scenario · For independent analysis · Not personal investment advice
- The chart shows movement through 4 440, followed by 4 420, 4 400 and 4 375.
- The initial downward move matched the scenario's direction.
- Price reached all three lower levels.
- The return to 4 500 and another decline extend beyond the drawn path.
Limits of the conclusion
- Hourly open, high, low and close prices are needed to verify hourly candle closes and the order in which conditions were met.
- The image cannot establish the exact low or calculate trading results.
Consider the entire price path: reaching targets and the subsequent recovery are parts of the same outcome.